
data
Beyond GDPR: Navigating the Next Wave of Data Regulations
Exploring different data acts shaping the emerging data and AI landscape across countries.
A Forrester study reveals that data-driven businesses are growing at an average of over 30% annually and are expected to capture $1.8 trillion annually from their less data-driven peers by 2025. Yet, despite this growing reliance on data, many organizations still need to work on harnessing its full potential.
Traditionally, the process of extracting insights from data has been complex and time-consuming, often requiring the intervention of specialized IT teams. Business intelligence (BI) tools were typically limited to technical experts, creating bottlenecks that slowed down decision-making and restricted access to critical insights. The rise of self-service BI and data visualization tools marks a significant transformation in how businesses approach data.
This article examines the increasing demand for self-service BI and data visualization tools, highlighting how they empower organizations to make quicker, more informed decisions.
Self-service BI is a new approach that allows non-technical users to access, analyze, and generate insights from data without requiring the help of IT specialists or data scientists. In the past, BI was confined mainly to a select group of trained analysts who would extract and interpret data upon request. Self-service BI flips this model by offering intuitive, user-friendly tools that empower business users to perform data analysis themselves. According to a recent report by Dresner Advisory Services, 62% of organizations consider self-service BI as a critical factor in their data analytics strategy, emphasizing its growing importance across industries.
Meanwhile, data visualization refers to translating raw data into visual formats such as charts, graphs, maps, and dashboards. Visualization makes complex datasets easier to understand by presenting them in a way that highlights patterns, trends, and anomalies. It allows decision-makers to grasp insights quickly without needing to sift through dense spreadsheets or reports. The importance of data visualization cannot be overstated. Research by Aberdeen shows that managers using visual data discovery tools are 28% more likely to find timely information than those relying solely on reporting and dashboards.
Together, self-service BI and data visualization transform how businesses interact with their data. They provide the foundation for a more agile, informed, and efficient decision-making process, shifting analysis power from technical experts to everyday business users.
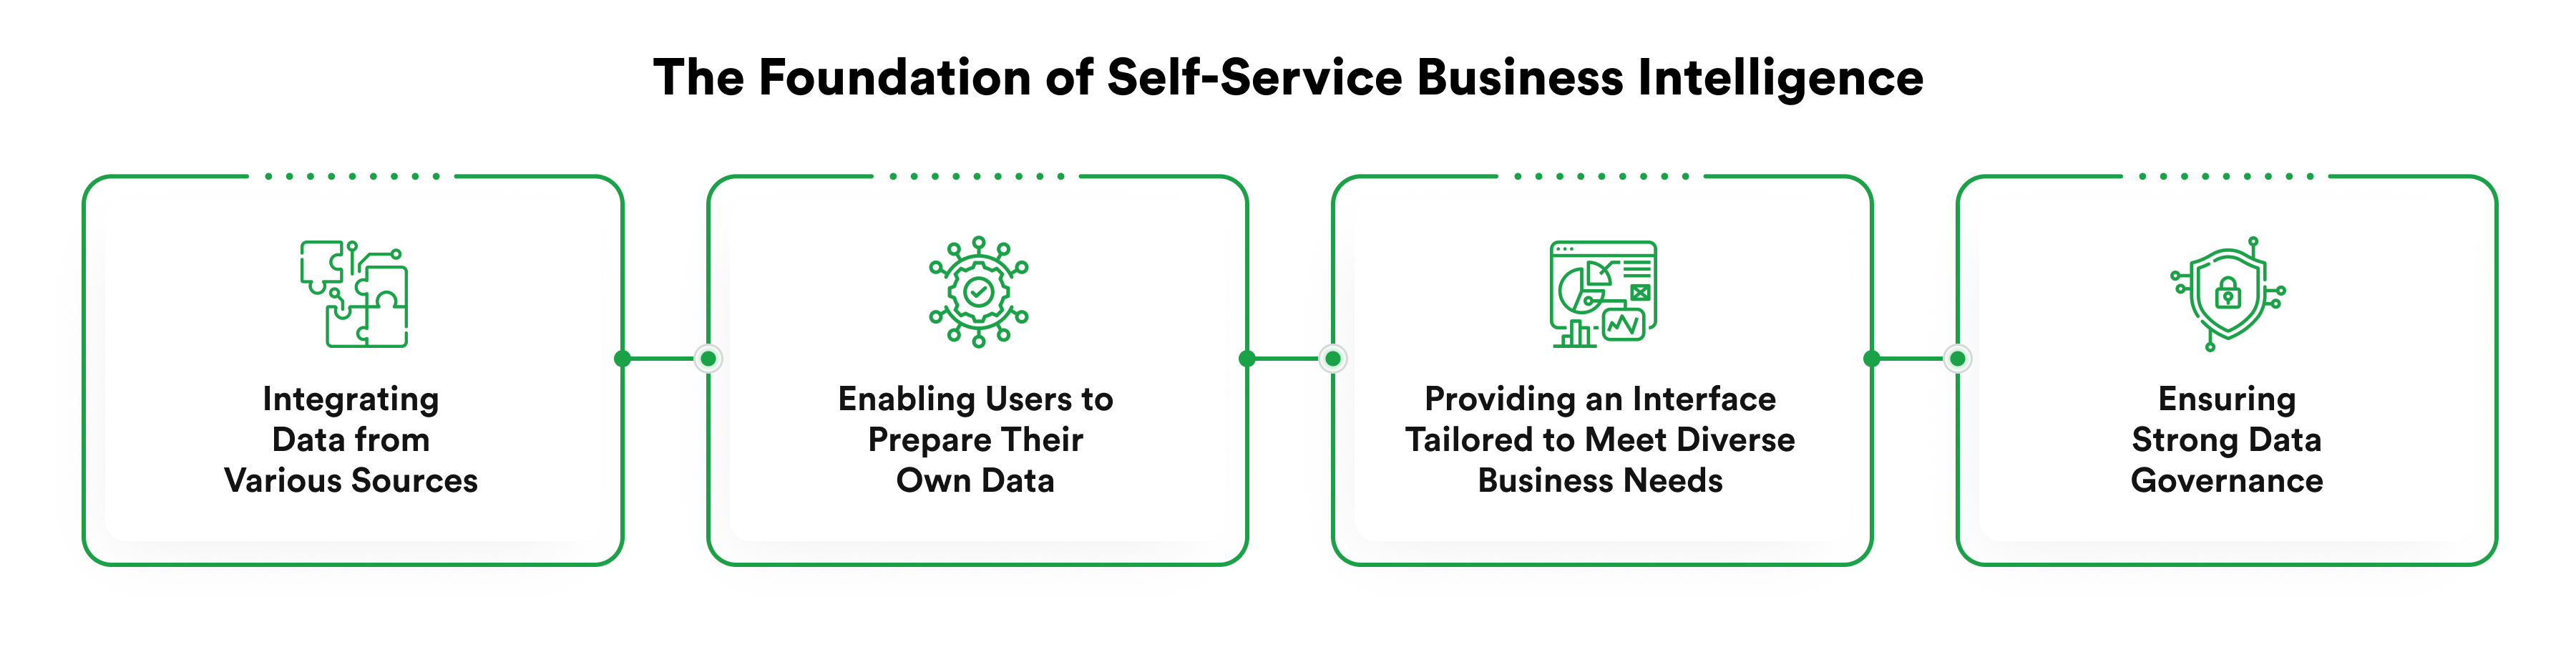
Self-service BI platforms are built around several key components that empower non-technical users to work with data effectively.
Data access and integration allow users to connect seamlessly to multiple data sources, whether in internal databases, cloud storage, or third-party systems. This capability ensures that users can gather data from all relevant streams and aggregate it for comprehensive analysis. A survey from Transforming Data with Intelligence (TDWI) shows that 67% of organizations prioritize platforms that can easily integrate with multiple data sources.
Modern self-service BI tools have intuitive drag-and-drop features, enabling users to build reports, visualize data, and create dashboards without writing code. These platforms prioritize simplicity, ensuring business users can quickly learn and navigate the system.
A critical aspect of self-service BI is real-time analytics and reporting. Traditional BI systems often involve delayed data access, leading to outdated insights and slow reaction times. Self-service BI solutions provide real-time analytics, allowing users to work with the most current data available. According to IDC, organizations that leverage real-time data for decision-making are expected to achieve a 20% increase in business outcomes by 2024.
Data visualization is crucial in making sense of the vast amounts of data modern businesses generate. By translating raw data into visual formats, data visualization enables users to quickly identify trends, patterns, and outliers that might be missed when looking at data in its raw form.
One of the most significant advantages of data visualization is its ability to facilitate quicker decision-making. Dashboards and reports that present data visually allow users to absorb information faster than they would by reading through data tables.
Another critical benefit of data visualization is its ability to communicate complex data insights to a broader audience. Not all decision-makers are data experts, so presenting information visually allows even non-technical stakeholders to understand and act upon data-driven insights.
Moreover, data visualization supports data-driven storytelling, where complex data can be transformed into compelling narratives that drive strategic decisions. Visualization tools can create reports and presentations that tell a story with data, helping persuade stakeholders or justify business decisions with clear and actionable insights.
In traditional BI setups, business teams are required to submit data requests to IT or data analytics departments, which can result in long wait times and delayed decision-making. This reliance not only slows down processes but also creates bottlenecks that restrain agility and responsiveness.
Employees are unable to explore data freely, as they must rely on pre-built reports and dashboards generated by IT or external consultants. This limitation restricts creativity and flexibility in data exploration, which can prevent teams from discovering key insights.
Data remains siloed within specific departments or technical teams, preventing a holistic view of the organization’s performance. When data is not democratized, only a small portion of the workforce can access the insights necessary for making informed decisions, leading to missed opportunities and inefficiencies.
Traditional BI tools are often rigid, requiring users to follow predefined queries and reports. This inflexibility makes it difficult for users to ask new questions or explore data from different angles without requesting additional work from IT teams.
With the automation and validation processes embedded in self-service BI platforms, human data entry, analysis, or interpretation errors can result in better reports, leading to better business decisions.
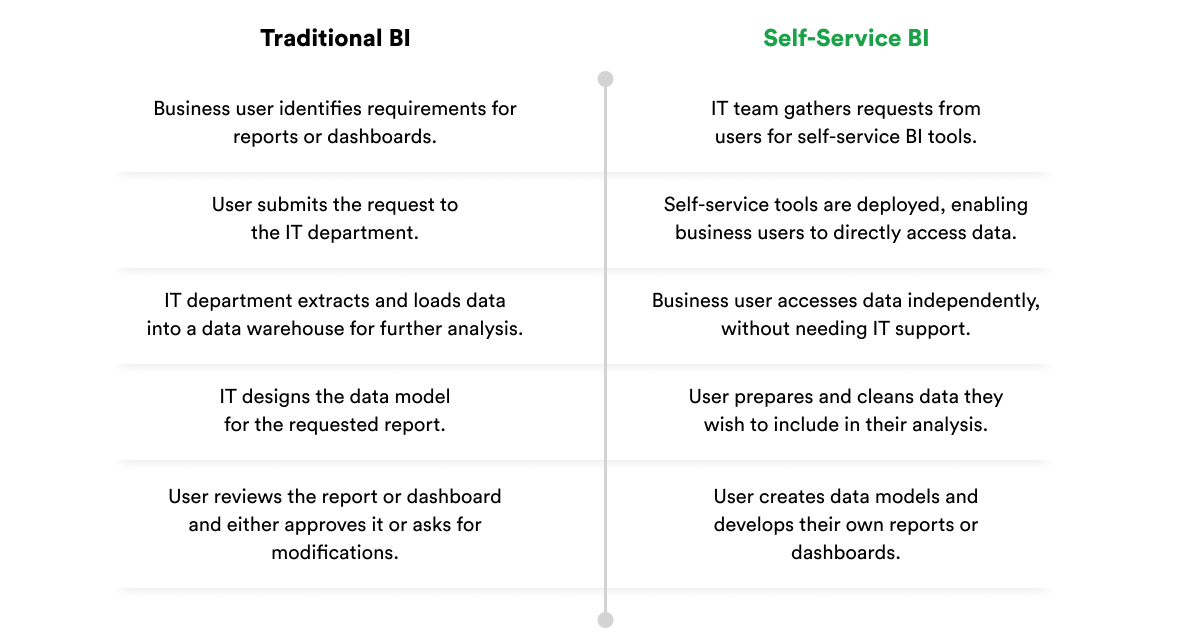
Self-service BI tools provide non-technical users, such as marketers, sales teams, operations managers and others, with direct access to data insights, enabling them to independently query data, explore insights, and create custom reports. Unlike traditional business intelligence models, self-service BI empowers users to work with data through intuitive interfaces, reducing dependency on technical teams and speeding up the decision-making process. By reducing the burden of routine reporting tasks on IT teams, these experts can redirect their focus toward more strategic initiatives, creating a more efficient and empowered workplace.
Self-service BI and data visualization are crucial for improving decision-making processes within organizations. By providing real-time access to data and empowering non-technical users to analyze it, these tools help businesses accelerate their decision-making cycles. Self-service BI tools reduce errors and biases in data interpretation. By enabling users to interact directly with data, organizations can minimize the risk of miscommunication or incorrect assumptions that often arise when insights are passed through multiple layers of analysis. With real-time data visualization, decision-makers can more accurately interpret trends and patterns, which leads to more precise, informed decisions.
Self-service BI is crucial in enhancing operational efficiency by streamlining reporting processes and reducing the reliance on IT teams for routine data analysis. IT teams can become overwhelmed with basic reporting requests, which slows down their workflow and prevents them from focusing on more strategic initiatives such as system upgrades, security improvements, or advanced data projects. By implementing self-service BI tools, organizations can free up IT resources. Business users can create and customize their reports, reducing the backlog of requests and empowering IT teams to concentrate on higher-value tasks. Additionally, self-service BI enhances operational efficiency by streamlining the reporting process across departments.
Investing in self-service BI and data visualization tools also helps foster an organization’s data-driven culture. When employees at all levels access the same data and insights, it encourages collaboration, transparency, and more consistent decision-making across departments.
One key barrier to this transition is the lack of accessible tools for employees who aren’t data experts. Self-service BI removes this barrier by providing easy-to-use platforms that democratize data access, allowing employees across different levels and departments to make informed decisions.
Self-service BI and data visualization significantly enhance organizational agility and responsiveness by providing real-time access to data, allowing business users to make swift, informed decisions without relying on IT for reports. This capability enables organizations to quickly adapt to market trends, customer behaviors, and competitive pressures, whether by adjusting strategies, responding to feedback, or seizing new opportunities. Additionally, self-service BI fosters a more proactive organizational culture, empowering employees to act on data insights immediately, leading to faster decision-making and more efficient execution of business strategies, which strengthens a company’s competitiveness in dynamic markets.
Investing in self-service BI and data visualization can generate significant cost savings and a strong ROI for organizations by reducing reliance on expensive resources such as specialized data analysts, IT support, and external consultants. With self-service BI, employees across departments can independently handle their own data analysis and reporting, eliminating the need for outsourcing complex tasks. Additionally, these tools streamline and automate many manual data processes, lowering ongoing analysis costs. Beyond direct savings, self-service BI enhances operational efficiency and improves decision-making, helping organizations avoid costly mistakes and further boosting ROI.
A key advantage of self-service BI is the democratization of data across the organization, breaking down traditional barriers where data access was limited to technical experts or specific departments. With self-service BI, employees at all levels can access, explore, and analyze data independently, resulting in more informed and faster decision-making. This empowerment fosters greater ownership of work and encourages decisions that align with the company’s strategic goals.
Furthermore, democratized data access promotes cross-functional collaboration by breaking down departmental silos and creating a shared understanding of business performance, leading to more cohesive and aligned decision-making across the organization.
Investing in self-service BI and data visualization democratizes data access and cultivates a culture of data-driven innovation within organizations. By empowering employees to explore data independently, these tools encourage experimentation, uncover hidden opportunities, and foster innovative solutions to business challenges. This culture of innovation is essential for remaining competitive in today’s fast-paced business environment.
As employees manipulate data in real time and ask new questions, continuous improvement is driven across all levels of the organization. Additionally, embracing data-driven innovation helps companies stay ahead of industry trends and leverage emerging technologies that offer deeper insights, predictive capabilities, and automated decision-making.
As organizations adopt self-service BI and data visualization, ensuring data quality and governance becomes crucial. With more users accessing data, the risks of inconsistent usage, duplicated efforts, and incorrect conclusions rise without robust governance in place. Poor data quality can severely impact decision-making, potentially leading to flawed strategies and costly financial consequences—industry reports estimate that poor data quality costs organizations an average of $12.9 million annually.
To address these challenges, strong data governance frameworks must be established to define access, manipulation, and sharing of data, ensuring accuracy, consistency, and reliability across the board.
A key challenge organization face when implementing self-service BI and data visualization tools is the risk of information overload. With access to vast amounts of data, users can easily become overwhelmed by too many metrics, reports, and dashboards, resulting in analysis paralysis.
To mitigate this, organizations should prioritize simplicity and clarity in their reporting and visualization strategies. Dashboards should be designed to focus on critical KPIs and business metrics, offering a clear overview of key insights tailored to different users, from executives to front-line employees. Implementing a tiered reporting approach allows users to drill down into detailed data when needed, avoiding the presentation of excessive information upfront.
With the growing adoption of self-service BI and data democratization, ensuring security and compliance has become a top priority for organizations. As more employees gain access to sensitive business data, the risks of data breaches, unauthorized access, and non-compliance with regulations such as GDPR and CCPA increase. According to IBM’s 2023 Cost of a Data Breach Report, the average data breach cost was $4.45 million, emphasizing the serious financial risks posed by poor data security.
To mitigate these risks, organizations must implement strong security protocols and compliance measures within their self-service BI environments. This includes securing access through user authentication, role-based access controls (RBAC), and encryption, both at rest and in transit, ensuring data is only accessible to authorized users based on their roles.
Measuring the impact of self-service BI and data visualization requires tracking key performance indicators (KPIs) that evaluate both tool adoption and the resulting business outcomes. Important KPIs typically include such metrics such as:
User adoption and engagement are critical indicators of success. If employees across departments are actively using the tools to generate insights and make decisions, the investment in BI is more likely to deliver value.
Additionally, tracking the reduction in time to insight, or the time it takes users to convert data into actionable insights, highlights the efficiency of self-service BI in speeding up decision-making processes.
Continuous improvement is vital for the ongoing success of self-service BI and data visualization initiatives, as users’ needs evolve over time. Regularly gathering user feedback helps organizations identify pain points, refine tools, and adapt to changing expectations. Iterative development, driven by user input, ensures that dashboards and reports remain relevant and aligned with organizational priorities.
As business requirements shift, organizations should scale their BI tools, accordingly, incorporating advanced analytics like predictive analytics or machine learning to unlock deeper insights. Additionally, by analyzing the usage and performance of BI tools, companies can identify beneficial features, areas needing improvement, and opportunities for enhancing user engagement and outcomes.
As organizations grow, their data and analytics needs expand, requiring effective scaling of BI initiatives to manage larger data volumes, integrate new sources, and support advanced analytics. Scaling self-service BI involves accommodating more users, handling complex datasets, and meeting evolving business needs. Investing in scalable infrastructure, such as cloud-based BI platforms, is key to ensuring flexibility and real-time processing capabilities.
As BI initiatives scale, businesses often integrate advanced analytics like predictive analytics, AI, and machine learning to move from descriptive and diagnostic insights to predictive and prescriptive strategies. Additionally, data governance practices must scale alongside these initiatives, ensuring data quality, security, and compliance through automated tools that maintain the accuracy and integrity of data-driven decisions
In today’s data-driven world, the ability to access, analyze, and act on data efficiently has become a cornerstone of business success. Self-service BI and data visualization tools have revolutionized how organizations interact with their data, enabling employees across all levels and departments to harness the power of real-time insights for more informed and timely decision-making.
Companies that invest in self-service BI and data visualization are not just making short-term decisions but positioning themselves for a future where data is the driving force behind every decision.
By partnering with a trusted technology provider like rinf.tech, organizations can confidently embark on their self-service BI journey, ensuring they have the expertise, tools, and support needed to unlock the full potential of their data and stay ahead in a rapidly evolving digital landscape.
Let’s talk.
Exploring different data acts shaping the emerging data and AI landscape across countries.

Delving into the intricacies of synthetic data generation, highlighting its diverse applications across industries, and more.

Showcasing rinf.tech’s comprehensive approach to data modernization, highlighting strategies that help transform traditional data systems into robust, agile, and future-proof platforms.